Crimespotting.org
Want to know where to buyavoid crack in San Francisco? Want to see where the bad people are? Crimespotting.org is the tool!
Want to know where your car is most likely to get stolen? Where you’re likely to get robbed? Crimespotting is the tool!
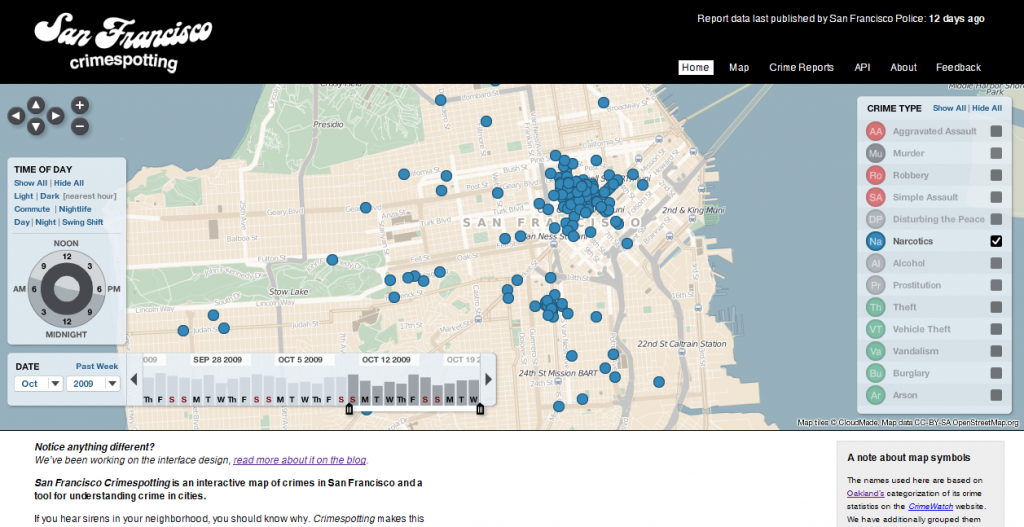
This is a map of narcotics arrests from October 11-21, 2009. Do you see a pattern? You can click on the dots to see what the crimes are. The vast majority in the tenderloin and that blip in Mission between 16th and 17th are for crack cocaine and drug paraphenalia. Now you know!
This is a phenomenal way to visualize crime data. Schuyler is planning an evening field trip in Oakland and is trying to find a place where he won’t get killed for just walking down the street. We found the spot… yes, we found a spot in Oakland with virtually no crime! And we can feel comfortable going there because we know there’s no crime in the area.
Check it out for yourself:

It’s easy to do some visualizations that show you just how dangerous an area is. For instance, Charlotte and I compared crime across all of San Francisco with crime all across Oakland. The result: There is roughly the same amount of crime arrests in the two cities (which makes Oakland a bit more dangerous per capita because of it’s smaller population). But it is very striking that San Francisco’s crime is very centralized in a few hot spots. Oakland’s crime is all over the place..
Schuyler just pointed out Crimereports.com. It’s a different interface, very useful as well. And they have access to many more cities crime data.